|
|||||||||
| The Constructivist Modeler | Java Applet | Aug 1999 | ||
About the Project(skip the rules and go to the Modeler) The Constructivist Modeler is a hybrid of Russian Avant Garde art from the beginning of this century and flow graph
The RulesIn traditional System Dynamics models, levels are represented by squares. Rates are represented by a symbol that resembles a valve (see image below). A flow of "water" from one level to another is represented by a line (called a "Flow arc") with an arrow to indicate the direction of the flow. If a rate is effected by its source level, this relationship is depicted with a dotted line, called a "Cause-and-effect arc."
Numbers = ColorsSystem Dynamics models use numbers to keep track of the value of levels (the volume of water in a container) and the value of rates (the speed of flow of water from one container to another). In the Constructivist Modeler, these numerical values are present. However, the numbers are primarily displayed as colors. Each numerical value between 0 and 100 is mapped to a color as indicated on the spectrum below. (Values below 0 or above 100 are not allowed in the Constructivist Modeler.)
Levels = Squares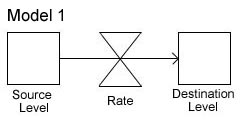
Levels are represented by squares in the Constructivist Modeler. "Flow arcs" with a constant rate are represented by an overlap between shapes, with the layer on top acting as the source level and the layer below acting as the destination level. Thus, two overlapping squares in the Constructivist Modeler are equivalent to two levels connected by a flow arc and a (constant) rate. Model 1, shown to the right, is the equivalent System Dynamics model for two overlapping squares in the Constructivist Modeler. 
The rate is a constant determined by the amount of overlap between the squares. The greater the amount of overlap, the greater the rate of flow between the two shapes. Model 2 and Model 3, shown below, are two different models built in the Constructivist Modeler. Both models are identical to the System Dynamics model above. However, Model 2 (in which the squares overlap more) has a higher rate constant. Thus the values (and therefore the colors) of the levels change faster. Given enough time, the color of the top square would be black (0) and the color of the bottom square would be red (100) in both Model 2 and 3. Triangles = RatesTraditional System Dynamics models use Cause-and-effect arcs to indicate that a rate is effected by the value of a level. For example, Model 4 shows a rate whose value is determined by the value of the Source Level. Rates that have Cause-and-effect arcs are represented by triangles in the Constructivist Modeler. Positive Cause-and-effect arcs (those in which the value of the rate is greater when the source level is greater) are represented by upward-pointing triangles. Downward-pointing triangles represent negative Cause-and-effect arcs (those in which larger values of the source level cause smaller rate values). Models 5 and 6 are the Constructivist Modeler equivalents of the System Dynamics model shown in Model 4. Model 5 shows a positive Cause-and-effect arc. Model 6 shows a negative Cause-and-effect arc. As the value of the Source level decreases, the value (and therefore the color) of the triangle in Model 5 decreases while the value (and therefore the color) of the triangle in Model 6 increases. Although System Dynamics models allow for Cause-and-effect arcs to originate from destination levels or levels that are not otherwise connected to a rate, the Constructivist Modeler currently only represents Cause-and-effect arcs that originate from a source level.
In addition to being effected by the value of the source level, rates values are effected by the amount of overlap with their source level. Triangles that have a high percentage of their area being overlapped by a square will have larger rate values. Also, destination levels will receive more "water" from a triangle that overlaps a larger area of the destination level's square. As before, squares that overlap on top of triangles act as source levels. Squares that are overlapped by the triangle are destination levels. When a triangle is overlapped by another triangle, the destination triangle (the one on the lower layer) takes as its value the value of source triangle squared. This squared rate value is then adjusted so that a source triangle with a value of 50 will create a destination triangle with a value of 50. A source triangle with a value of below 50 will create a destination triangle with a value below that of the source. A source triangle with a value above 50 will create a destination triangle with a value above that of its source. This is seen in Model 7. A gray source triangle (one that has a lower value) produces destination triangles with value that are even closer to 0 (and thus closer to black). A blue source triangle (with a value close to 50) produces destination triangles of about the same color/value. A cyan source triangle produces destination triangles that are closer to red (100). This allows the Constructivist Modeler to create nonlinear models. Unlike the previous models shown, the amount of overlap between 2 triangles has no effect on the value of either triangle. Circles = Feedback
Because the Constructivist Modeler uses layers to represent which shape is a source and which shape is a destination, it is impossible for a shape to be both a source and a destination of another single shape. For example, a square cannot overlap a triangle while also being overlapped by the same triangle. This makes it difficult to create feedback loops in the Constructivist Modeler. Since feedback loops are an important part of System Dynamics models, circles are introduced to provide a means of feedback. An example of a System Dynamics Model with feedback is shown in Model 8. Circles in the Constructivist Modeler always come in pairs and are on different layers. The value of the circle on the lower layer is the same as the value of the layer that overlaps with the circle (usually a square or a triangle, though conceivably Go to the Constructivist Modeler Go to the Demo versions and notes for the Constructivist Modeler. Created by Josh Weihnacht |
|||
 models from System Dynamics. It is intended to be used as both a data visualization program and an animation tool. The project uses many of the concepts and rules familiar to System Dynamics (levels, rates), but reinterprets them visually using the abstract geometric style of Russian Constructivist and Suprematist art.
 System Dynamics models, which are often used to predict things such as the patterns of population change between different species in a food chain, can be described with a metaphor of water. In System Dynamics models there are levels (containers of water) and rates (valves connecting levels). Some rates are constant. They always allow the same amount of water to flow from the source level to the destination level. Other rates may let more water flow out of the source level as the source level gets higher. (In this case the source level has a positive effect on the rate. A real world example would be that the greater the number of people the greater the birth rate.) Still other rates may let less water flow out of the source level as the source level gets higher. (In this case the source level has a negative effect on the rate. An example would be, the more food there is the lower the starvation rate.)
 The Constructivist Modeler maps these System Dynamics symbols onto a visual vocabulary inspired by Constructivist art. Russian Constructivist art of the 1920's is typically characterized by geometric shapes and areas of solid color. They did this in part to create a new art for their (at the time) new revolutionary society. They also believed that by eliminating imagery that only had significance within a certain culture at a certain time, and replacing it with abstract and supposedly universal shapes and colors, they could communicate more directly with the masses of humanity. Likewise, the Constructivist Modeler replaces scientific symbols and equations with colors and shapes in order to make the modeler more accessible. Conversely, the Constructivist Modeler uses scientific models as a basis for artistic animation in order to use the patterns of data flow that System Dynamics models capture as visual patterns for animation.


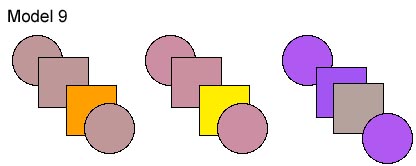 another circle). If multiple shapes overlap the bottom circle, the value of the circle is the average of the value of all the shapes that overlap it. The amount of overlap between the circle and the other shapes is not used to determine the value of the circle. The value of the upper circle in the pair is the same as the value of the lower circle. In this way "water" is carried up to a higher level. Squares that overlap a circle will lose value to that circle (just as they would if that square overlapped another square). Squares and triangles that are overlapped by a circle use that circle as an input for value. Model 9 shows a Constructivist Modeler equivalent to the System Dynamics model shown in Model 8.